Articles · Research
A UT Dallas study paired satellite readings of eight air pollutants from 2022 with CDC cancer data for all 254 Texas counties, and found that counties with more pollution tended to have more cancer
UT Dallas researchers paired satellite air readings with CDC cancer data for every Texas county. Dirtier counties tended to have more cancer, and the authors say what that can't prove.
Read the story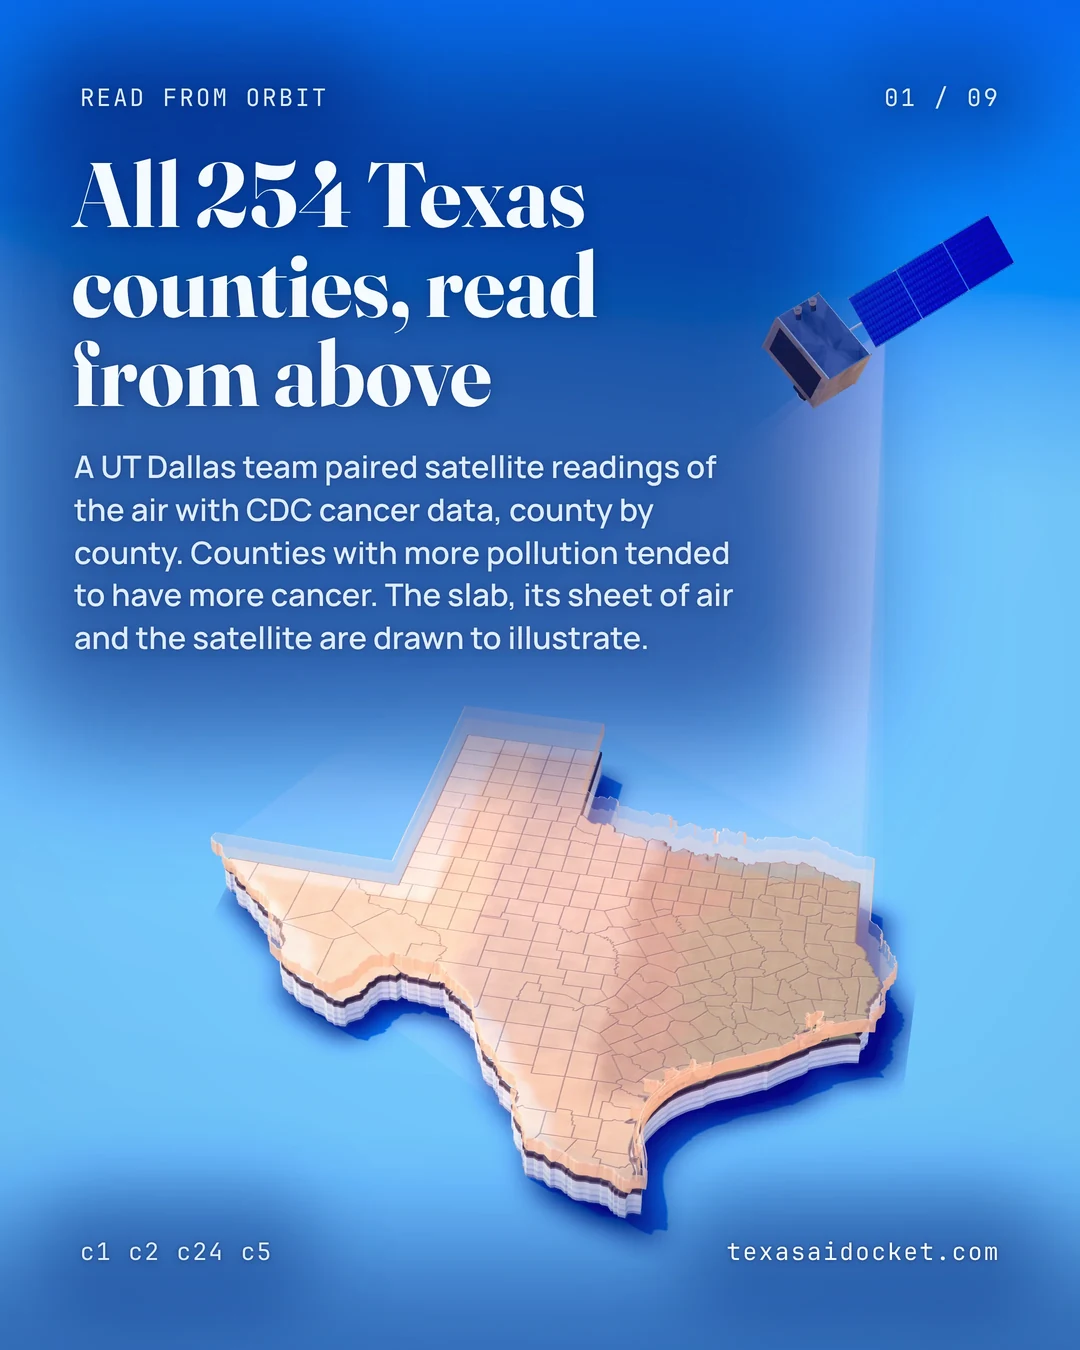

A team in UT Dallas's School of Economic, Political and Policy Sciences studied all 254 Texas counties and found geographic associations between air pollution and cancer prevalence. It used public CDC data on cancer prevalence and satellite data on air pollution, and applied a machine learning method to the correlations.
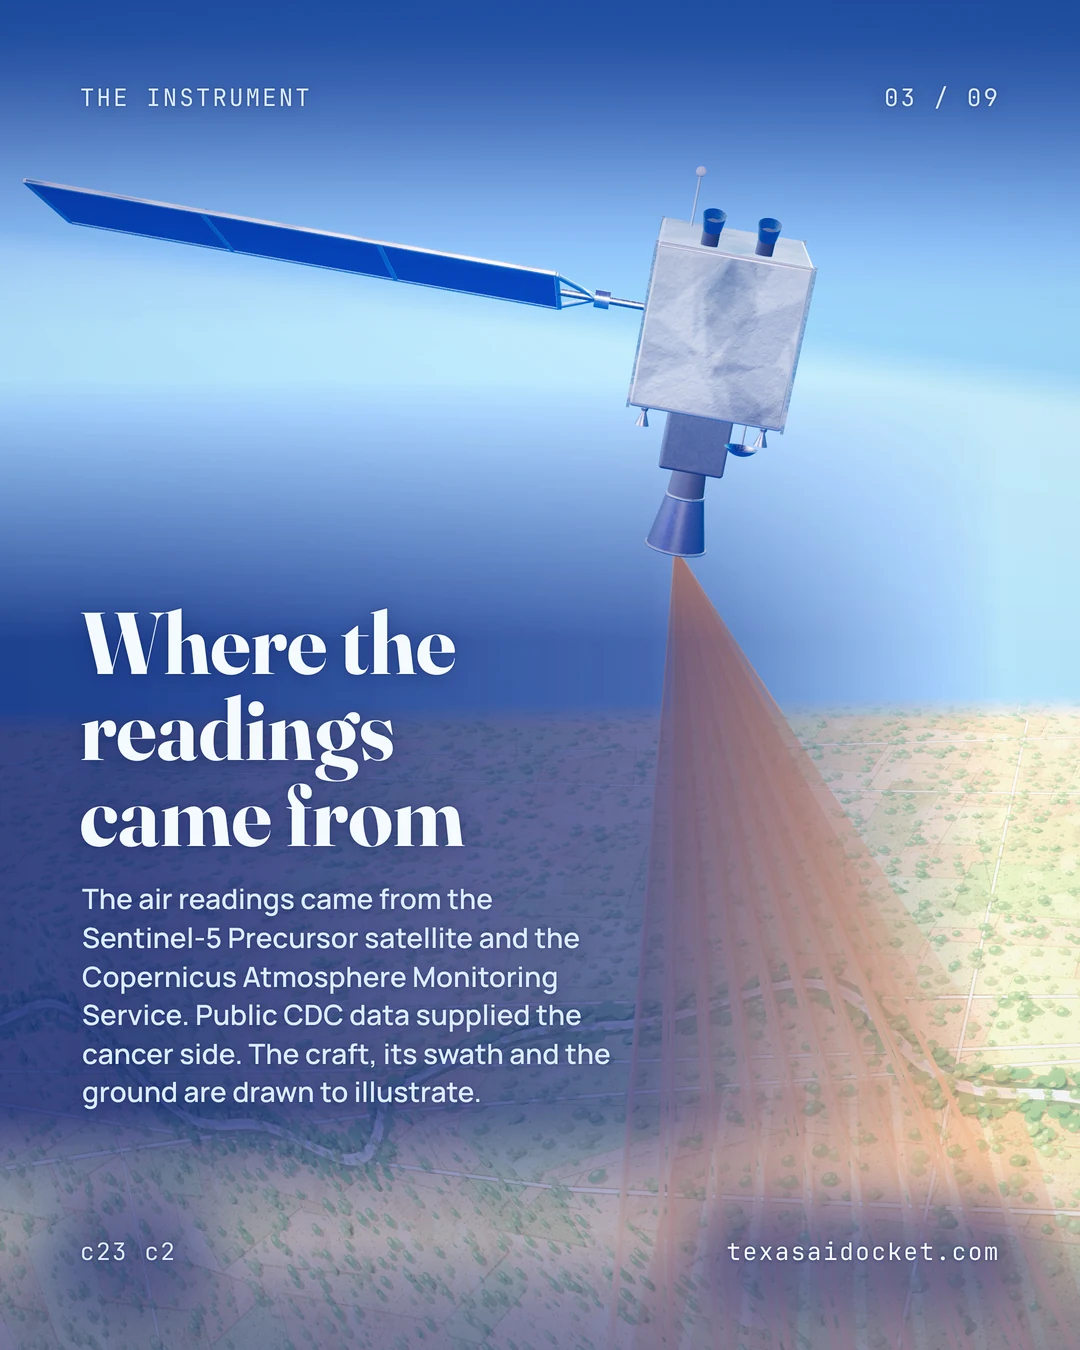
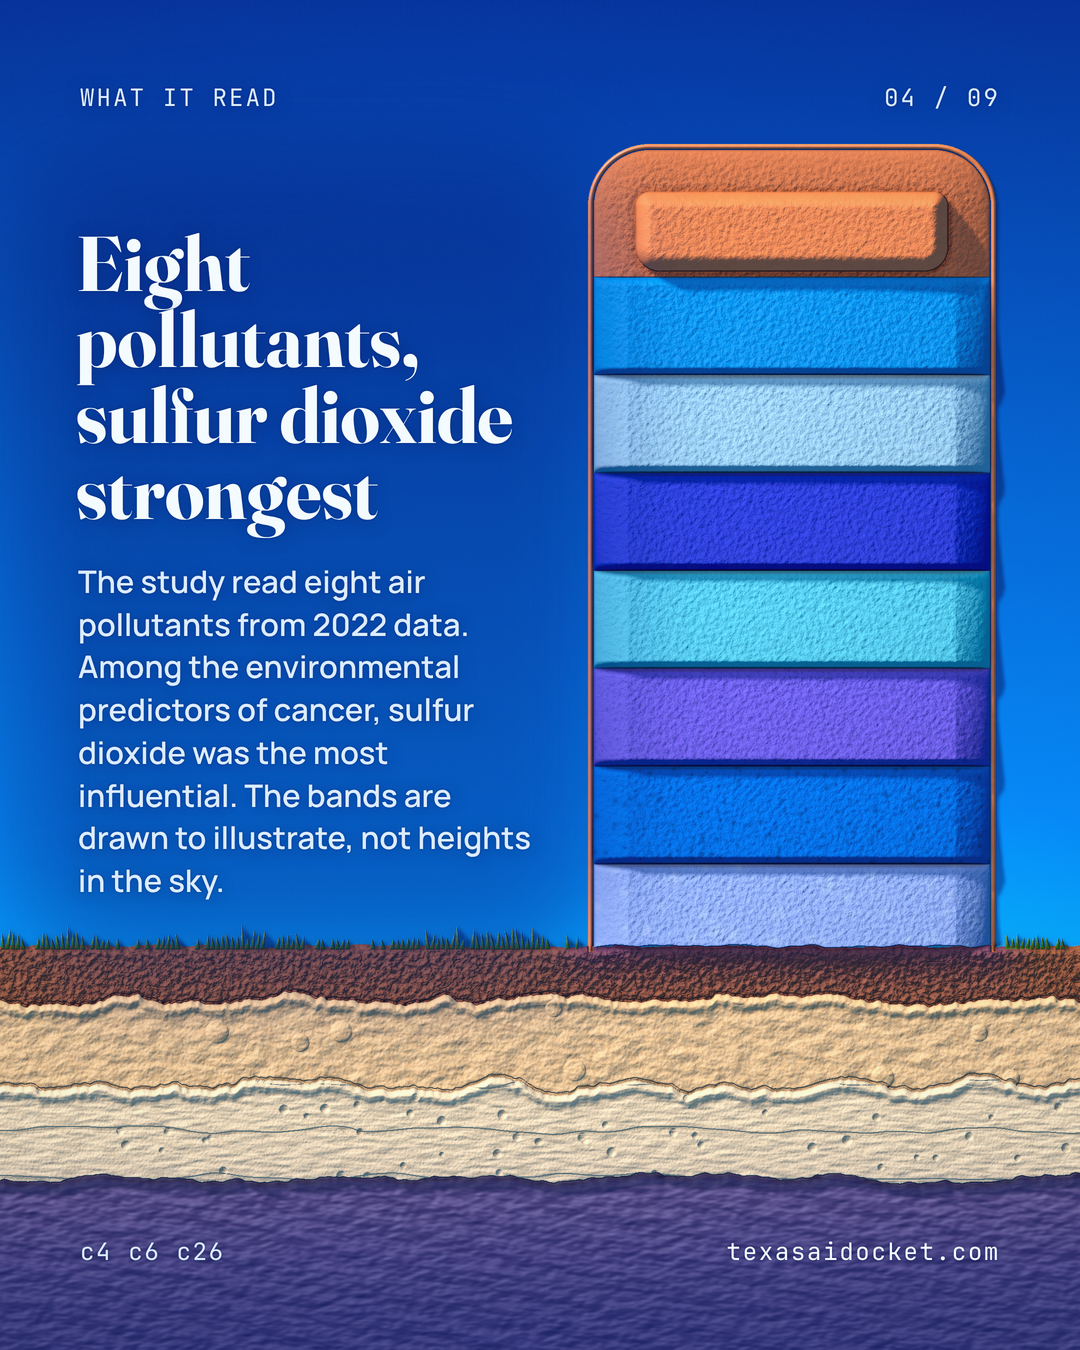
The satellites measured eight air pollutants in 2022, among them sulfur dioxide, nitrogen dioxide, carbon monoxide, formaldehyde and methane. The readings came from the Sentinel-5 Precursor satellite and the Copernicus Atmosphere Monitoring Service. The paper went online in March in Environmental Monitoring and Assessment.
What the model found
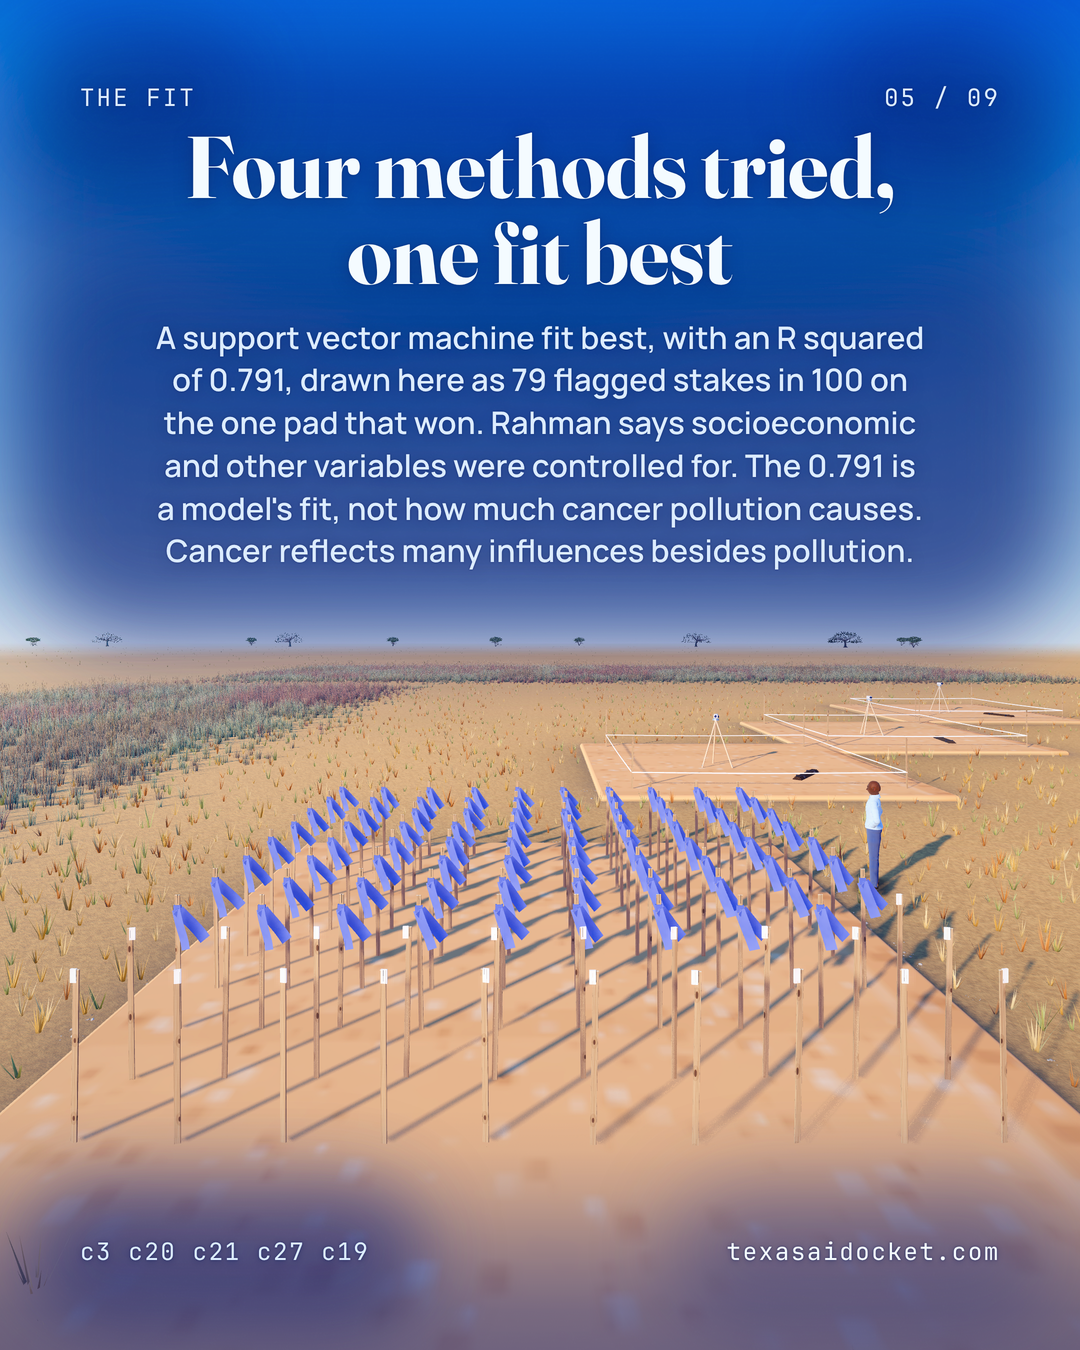
Counties with more pollution tended to have more cancer. Sulfur dioxide was the most influential environmental predictor. The paper compared four machine learning algorithms, and a support vector machine fit the data best. Rahman says socioeconomic and other variables were controlled for.
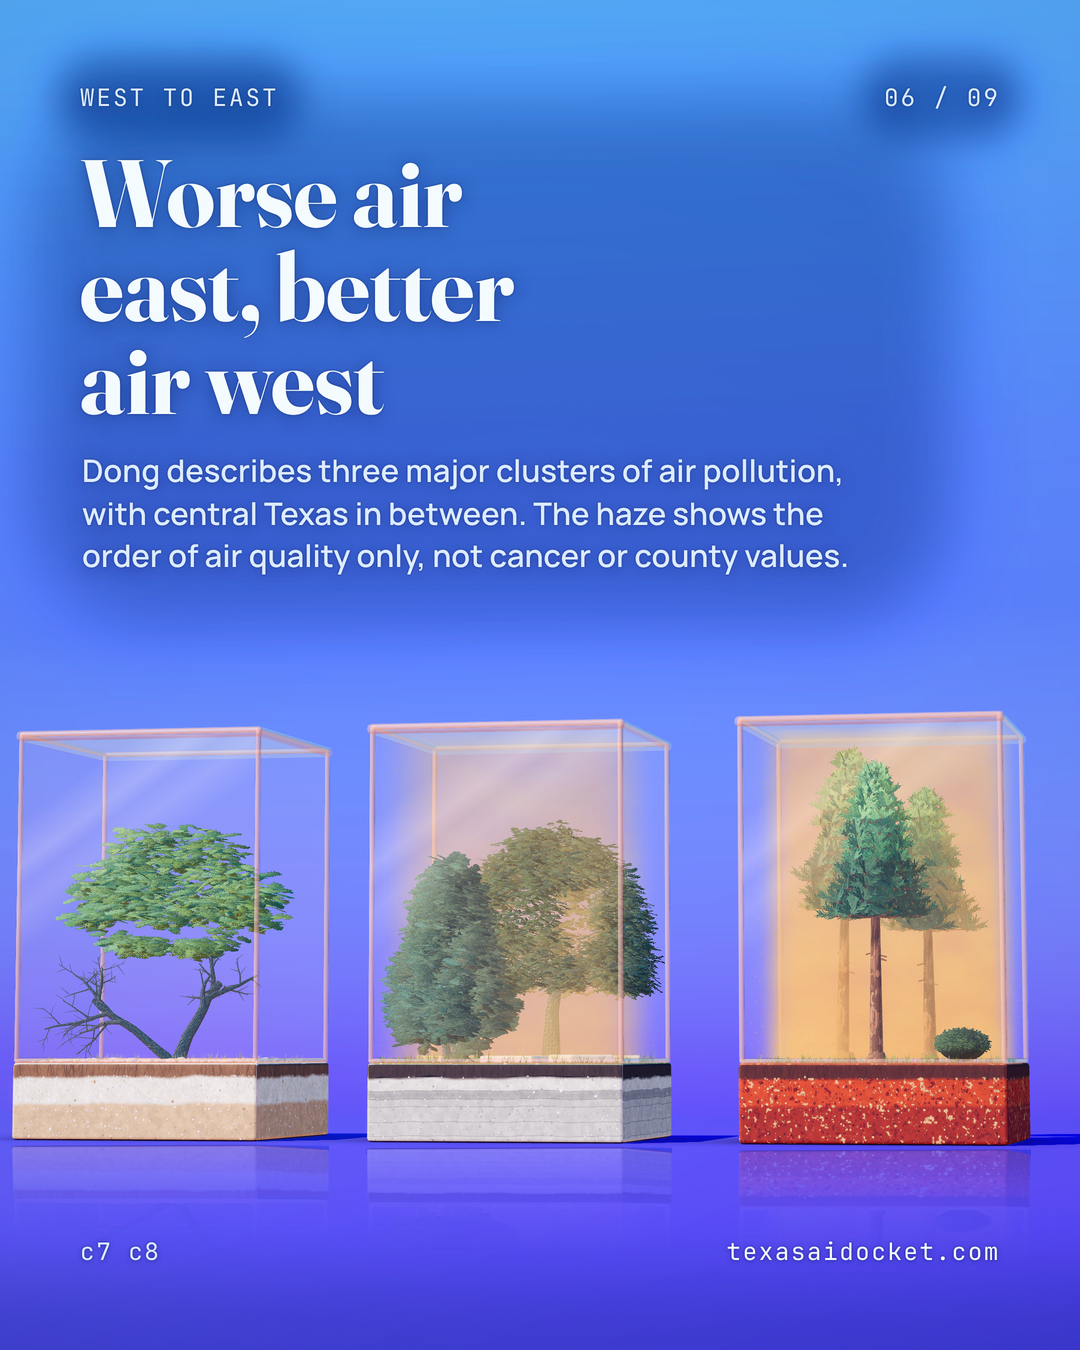
Fangchao Dong, a doctoral student and co-corresponding author, describes three major clusters of air pollution in Texas. The east part of the state is worse in air quality, the west is better and the central part sits in between. Counties with higher cancer prevalence tended to sit near others with similarly high prevalence rather than at random.
Why satellites
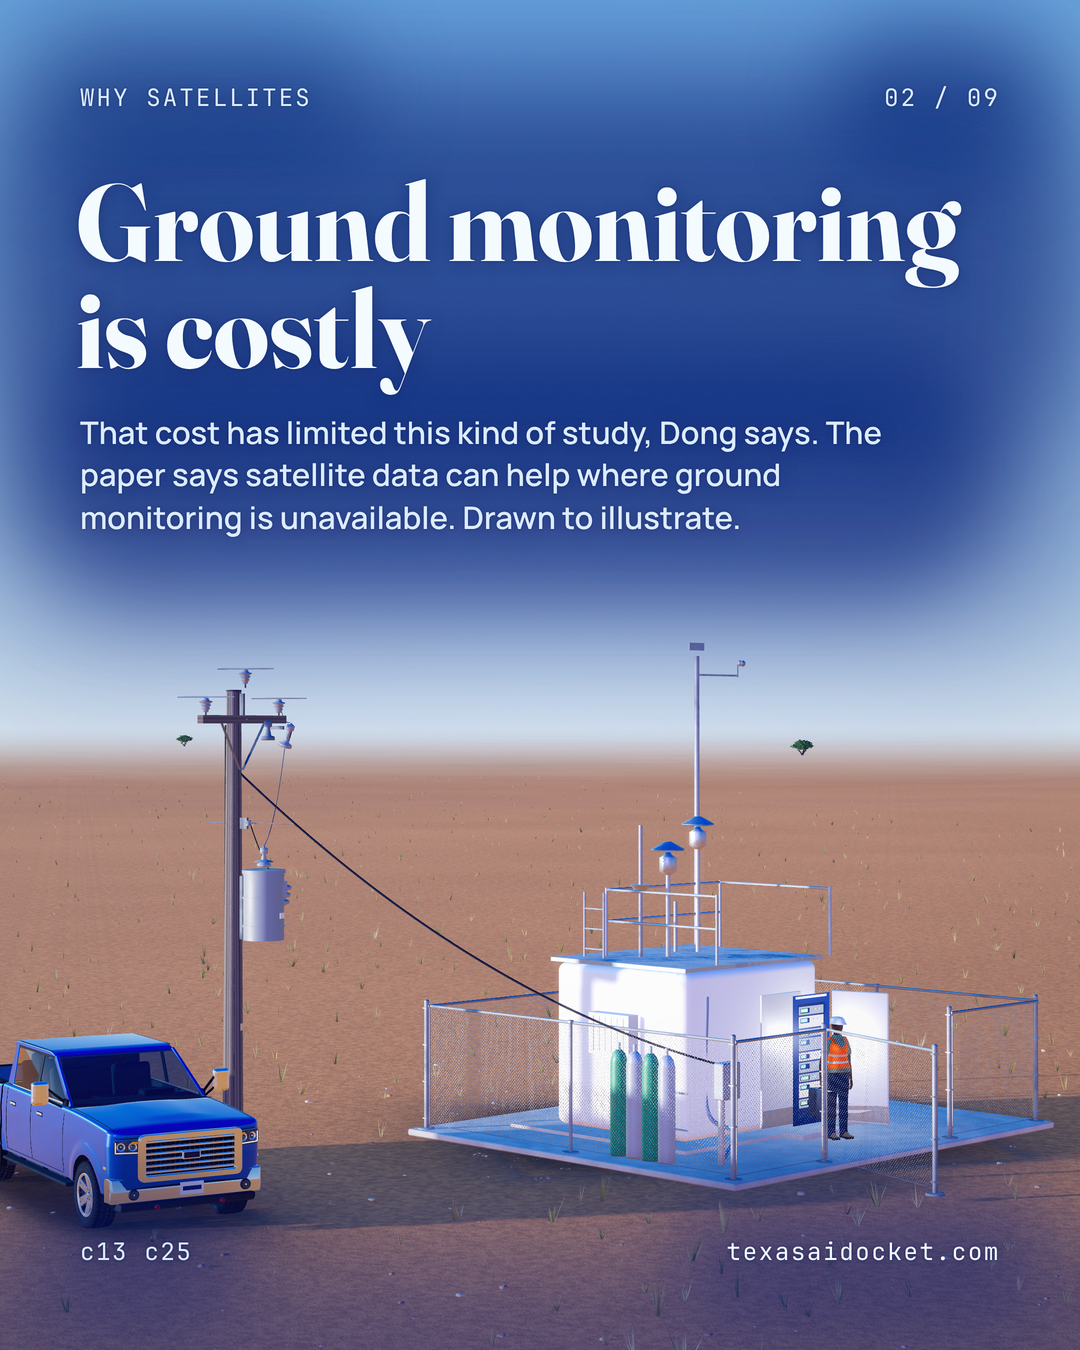
Collecting pollution data from monitors on the ground is costly, which has limited this kind of spatial analysis. Remote sensing let the team look at air pollution across all of Texas, and the paper says satellite data can support health assessment where ground monitoring is unavailable. The team says the method can also show where medical centers are and where government should focus.
What it can't show
The study did not find that every more polluted place had more cancer, and the researchers say cancer reflects many influences besides pollution. They say the results are not sufficient evidence of a causal link between pollution and cancer risk in any one person.
Satellite readings may also be less precise than readings from ground monitors, and the team wants more research on the cost and accuracy of the approach. The published findings describe places, so a reader can't use them to judge the risk to a particular person or to rank a particular county.
Sources for this story
- UT Dallas News Center, Study: How Data, AI Could Identify Texas Health Patterns, November 6th
- Dong, Rahman and Chen, Spatial analysis of air pollution and cancer prevalence in Texas: a machine learning approach using satellite remote sensing data, Environmental Monitoring and Assessment, published March 5th
Claim-by-claim verification · 27 claims
The UT Dallas team studied all 254 Texas counties and found geographic associations between air pollution and cancer prevalence.
In a study of all 254 Texas counties, a team from the School of Economic, Political and Policy Sciences found geographic associations between air pollution and cancer prevalence.
The researchers used CDC cancer prevalence data and satellite air pollution data.
Researchers used publicly accessible data collected from the Centers for Disease Control and Prevention on cancer prevalence and satellite data on air pollution to identify patterns, said geospatial information sciences doctoral student Fangchao Dong, co-corresponding author of the study.
The team applied a machine learning method to the correlations.
And we applied a machine-learning method to analyze the correlations.
The satellites measured eight air pollutants in 2022.
Dong and other researchers analyzed data collected by a suite of remote-sensing satellites in 2022 of eight air pollutants: sulfur dioxide, nitrogen dioxide, carbon monoxide, formaldehyde, methane, particulate matter smaller than 1 micrometer, particulate matter smaller than 10 micrometers and aerosols.
Counties with more pollution tended to have more cancer.
The researchers found that Texas counties with higher concentrations of pollutants also tended to have higher cancer prevalence.
Sulfur dioxide was the strongest environmental predictor.
Sulfur dioxide was the most influential environmental predictor of cancer.
Dong says Texas air pollution falls into three major clusters.
There are three major clusters of air pollution in Texas,” Dong said.
East Texas is worse in air quality and the west is better.
What we found is that the east part of Texas is worse in air quality, while the west is better. The central part of Texas is somewhere in between.
High cancer counties sit near other high cancer counties.
Counties with higher cancer prevalence tended to be near other counties with a similarly high prevalence, rather than being randomly distributed across Texas.
Not every more polluted place had more cancer.
The study did not find a simple relationship in which every more-polluted location had higher cancer prevalence.
The authors say the result does not establish that pollution causes cancer in individuals, and the paper appeared online March 5th.
The researchers caution, however, that the results, published online March 5 in the journal Environmental Monitoring and Assessment , do not constitute sufficient epidemiological evidence to establish a causal relationship between air pollution exposure and cancer risk at the individual level.
Satellite readings may be less precise than ground monitors.
But there are also limitations: The satellite data may not be as precise as data obtained through ground monitoring.
Collecting pollution data from ground monitors is costly, which has limited spatial analyses in the past.
In the past, spatial analyses using remote-sensing data have been limited, Dong said, because collecting pollution data from monitors on the ground is costly.
The team says the method can show where medical centers sit and where government should focus.
This allows us to not only look at past trends, but it also allows us to look at the distributions of medical centers and facilities and see what the government needs to focus on for the betterment of all Texans suffering from cancer.
Muhammad Tauhidur Rahman is an associate professor of geospatial information sciences and sustainability.
Dr. Muhammad Tauhidur Rahman, associate professor of geospatial information sciences and sustainability
Doctoral student Hao Chen also worked on the study.
Geospatial information sciences doctoral student Hao Chen also contributed to the study.
Remote sensing lets the team look at air pollution across all of Texas.
This remote-sensing technology gives us the chance to look at air pollution across all of Texas,
The team wants further research on cost and data accuracy.
We need to do further research to deal with the challenges, like the cost and the data accuracy.
Cancer reflects many influences besides pollution.
Cancer patterns reflect multiple influences, not just pollution alone, the researchers said.
The paper compared four machine learning algorithms.
Random Forest, Support Vector Machine, Multi-Layer Perceptron, and Ordinary Least Squares
The support vector machine model performed best, with an R squared of 0.791.
SVM showed the best performance (RMSE = 0.347, R2 = 0.791)
Cancer prevalence across counties was strongly clustered, with a Moran's index of 0.69.
high spatial autocorrelation (Moran’s I = 0.69)
The pollution data came from the Sentinel-5 Precursor satellite and the Copernicus Atmosphere Monitoring Service.
Sentinel-5 Precursor and the Copernicus Atmosphere Monitoring Service.
The paper covers all 254 Texas counties in 2022.
across all 254 Texas counties in 2022
The paper says satellite data can support health assessment where ground monitoring is unavailable.
where ground-based monitoring is unavailable
The paper names sulfur dioxide as the strongest environmental predictor.
identified SO2 as the most influential environmental predictor
Socioeconomic and other variables were controlled for, Rahman says.
Socioeconomic and other variables were controlled for, said Dr. Muhammad Tauhidur Rahman